The Fastest Way to Know a Dividend's Safety.
Dividend coverage ratio. Here's what it measures, what a safe number looks like, and how to check it in under two minutes before your next income stock buy.
7/23/20267 min read


The dividend coverage ratio measures how many times a company's earnings can cover its dividend payments, giving you a reality check on whether those payouts are sustainable or heading for a dramatic cut. Think of it as the financial equivalent of checking if someone can actually afford that fancy car they're driving, or if they're one flat tire away from financial chaos. A company might be throwing cash at you now, but if their earnings only barely cover those payments, you could be in for an unpleasant surprise.
Most investors stop at yield and call it a day, but you're smarter than that. Understanding dividend coverage helps you separate the reliable income producers from the companies that are basically using a credit card to pay their dividends. Let's dig into how this ratio works and why it beats staring at yield percentages alone.
Key Takeaways
The dividend coverage ratio shows how many times a company can pay its dividend from earnings, with a ratio above 2 considered healthy
A low or declining coverage ratio below 1.5 warns you that dividend cuts may be coming soon
Using coverage ratios alongside dividend yield helps you avoid companies that can't sustain their current payouts
Cracking the Code: What the Dividend Coverage Ratio Really Means


The dividend coverage ratio tells you how many times a company can pay its dividend from its earnings. A ratio of 2.0 means the company earns twice what it needs to pay dividends, while anything below 1.0 means it's paying out more than it earns.
Dividend Coverage Ratio vs. Payout Ratio
Think of the dividend coverage ratio and payout ratio as two sides of the same coin. They both measure dividend safety, but they flip the math around.
The payout ratio shows you what percentage of earnings goes to dividends. If a company pays out 50% of its net income as dividends, that's your payout ratio. Simple enough.
The dividend coverage ratio, on the other hand, is the inverse. It tells you how many times the company could cover its dividend payout with its earnings. A 50% payout ratio equals a coverage ratio of 2.0 (because 1 divided by 0.5 equals 2).
Here's the quick conversion:


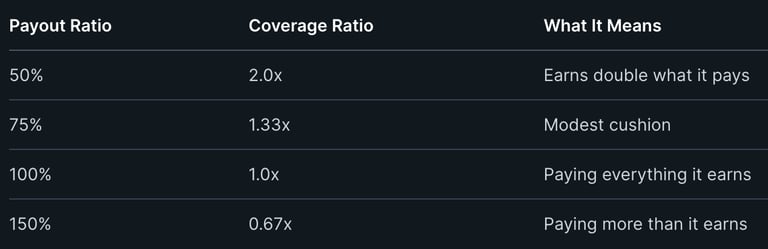
Most investors find the coverage ratio more intuitive. Saying "the company can pay this dividend twice over" is clearer than "it pays out 50% of earnings."
The Role of Net Income and Earnings per Share
Your dividend coverage ratio calculation depends on net income or net earnings. That's the profit left after paying all expenses, taxes, and everything else the accountants throw at it.
Dividend Cover Formula
There are two ways to calculate Dividend Cover. Both give you the same result.
Method 1: Using Total Company Figures
Dividend Cover = Net Income ÷ Total Dividends Paid
Method 2: Using Per-Share Figures
Dividend Cover = Earnings Per Share (EPS) ÷ Dividends Per Share (DPS)
Example
Net Income = $500 million
Total Dividends Paid = $250 million
Dividend Cover = $500M ÷ $250M = 2.0x
Or using per-share figures:
EPS = $5.00
DPS = $2.50
Dividend Cover = $5.00 ÷ $2.50 = 2.0x
Both methods show the company earns twice the amount needed to pay its dividend.
Bottom Line
As a general rule:
Above 2.0x = Healthy
1.5x–2.0x = Acceptable
Below 1.5x = Worth investigating
Below 1.0x = The company isn't earning enough to fully cover its dividend.
For most investors, you don't need to calculate Dividend Cover yourself. Many financial websites already provide EPS and DPS, making the per-share formula the quickest way to check a company's dividend safety.
Here's the catch with net income: it's an accounting number, not actual cash. A company might report strong net earnings on paper but still struggle to pay dividends if the cash isn't actually sitting in the bank. This happens when accounting rules let companies book revenue they haven't collected yet or when earnings include non-cash items like depreciation adjustments.
That's why savy investors also check free cash flow coverage. Cash is what actually pays your dividends, not accounting entries.
Coverage Ratios Across Industries
Different industries have wildly different "normal" coverage ratios. What looks healthy in one sector might signal trouble in another.
Utility companies typically run lower coverage ratios around 1.2 to 1.5. They have stable, predictable earnings and lower risk, so they can safely pay out more of what they earn. Tech companies that pay dividends often maintain higher ratios above 2.5 because their earnings can swing more dramatically year to year.
Real estate investment trusts (REITs) are the odd ones out. They're legally required to pay out 90% of their income, so their coverage ratios naturally sit closer to 1.1. For them, you really need to look at cash flow instead of the standard dividend cover calculation.
Manufacturing and industrial companies usually aim for ratios between 2.0 and 3.0. They need the cushion because their earnings can drop during economic downturns. A ratio above 2.0 gives them breathing room to maintain dividends even when times get tough.
Show Your Work: Calculating and Interpreting the Dividend Coverage Ratio
How to Calculate Dividend Cover (Yes, It's a Real Thing)
Dividend cover is just another name for dividend coverage ratio. People in different countries use different terms, but they mean the exact same thing.
You calculate it the same way: Dividend Cover = Net Income ÷ Dividends Paid
Some investors prefer saying "the dividend is covered 3 times" instead of "the dividend coverage ratio is 3." It's like saying "soda" versus "pop" - different words, same drink.
The term "dividend cover" is more common in the UK and other international markets. In the US, you'll hear "dividend coverage ratio" more often. Don't let the different names confuse you.
Interpreting the Numbers: What Is a Good Dividend Coverage Ratio?
A ratio above 2 is considered healthy. This means the company earns twice what it pays in dividends, leaving plenty of room for error.
A ratio below 1.5 should make you nervous. The company might struggle to maintain dividend payments if earnings drop even slightly.
If your ratio is below 1, the company is paying more in dividends than it earns. That's unsustainable and often means dividend cuts are coming.
Here's a quick guide:
Above 3: Very safe, lots of cushion
2 to 3: Good, comfortable margin
1.5 to 2: Okay, but watch closely
Below 1.5: Risky territory
Below 1: Danger zone
Remember that net income isn't actual cash. A company might show strong earnings on paper but lack the cash to pay dividends. Always check the balance sheet and cash flow statements too.
Dividend Coverage Ratio Calculator and Handy Shortcuts
You don't need fancy software to calculate DCR. A simple calculator or spreadsheet works fine. Just grab net income from the income statement and dividends paid from the cash flow statement.
Most financial websites already calculate this for you. Look for "dividend coverage" or "payout ratio" in the stock's financial metrics. The payout ratio is just the inverse - it shows what percentage of earnings goes to dividends.
Quick shortcut: If you see a payout ratio of 50%, the dividend coverage ratio is 2 (because 100% ÷ 50% = 2).
For a dividend coverage ratio calculator, you need two numbers: total net income and total dividends paid.
Practical Insights: Sustainability, Watchouts, and Using Coverage Like a Pro
A strong coverage ratio tells you if a company can pay dividends today, but sustainability signals show whether they can keep paying tomorrow. Red flags reveal when management is playing financial Jenga with your income stream.
Dividend Sustainability Signals
Dividend sustainability goes beyond a single number. You want to see coverage ratios that stay stable or improve over time, not ones that bounce around like a caffeinated squirrel.
Look for companies where dividends paid grow slower than earnings. This creates a buffer zone for rough patches. A payout ratio between 40-60% gives most companies breathing room, though REITs and utilities often run higher because their business models are more predictable.
Free cash flow matters more than accounting earnings. A company might show solid net income while burning cash to maintain equipment or expand operations. If free cash flow covers dividends per share with room to spare, you're in good shape.
Check whether debt levels stay manageable. Companies with heavy borrowing might funnel cash toward interest payments instead of dividends when times get tough. Real estate companies and REITs especially need low debt-to-equity ratios since their dividends are tied to property income.
Spotting Red Flags (Before It's Too Late!!)
Watch for coverage ratios that trend downward over multiple quarters. One bad quarter happens. Three consecutive quarters of shrinking coverage means trouble is brewing.
A rising dividend paired with flat or falling earnings screams danger. Management might be propping up dividends per share to avoid spooking investors, but math eventually wins.
Be extra cautious when companies borrow money to pay dividends. This works until it doesn't, and you'll be left holding a bag of disappointment. If debt grows faster than revenue, management is essentially using your future dividends to pay your current ones.
So, what is a good dividend coverage ratio?
Anything above 2.0 is solid for most sectors. REITs can safely operate around 1.2-1.5 due to their stable cash flows. Below 1.0 means the company is paying out more than it earns, which is like spending your rent money at a casino.
Conclusion
You've now got a powerful tool in your investing toolkit that beats staring at dividend yields like a deer in headlights. The dividend coverage ratio tells you whether a company can actually afford those sweet dividend payments or if they're just borrowing from Peter to pay Paul (spoiler alert: you're Paul).
A ratio above 2 means you're probably sleeping well at night. A ratio hovering around 1 means you should keep one eye open. Anything below 1? That's your cue to start asking some serious questions about whether this dividend will survive the next earnings report.
Remember these key points:
DCR = Net Income / Dividends Paid (simple math, powerful insights)
Above 2 is generally solid
Below 1 is a red flag waving frantically
Industry matters (utilities run leaner than tech companies)
Don't get fooled by a juicy 8% yield if the company's earnings can barely cover half of it. You're not investing in a fairy tale where money grows on trees that never need watering.
Check the dividend coverage ratio before you commit your hard-earned cash to any dividend stock. Your future self will thank you when those dividend checks keep rolling in instead of vanishing faster than free donuts in the break room.
Ready to find reliable dividend stocks?
Get started by opening your brokerage account first.
Contact
kbgholston445@gmail.com
© 2025. All rights reserved.