Dividend Payout Ratio Explained: Catch Dividend Cuts Before They Happen
By the time a company announces a dividend cut, most investors have already lost months of income. The payout ratio shows the warning signs early. Here's what to look for before your next dividend stock buy.
7/2/20269 min read


You might wonder why this number matters for your investment decisions. A company paying out 90% of its earnings looks very different from one paying out 20%, and neither is automatically better. The ratio reveals whether dividend payments are sustainable or if the company is living beyond its means. It also hints at whether you're dealing with a mature cash cow or a growth-hungry startup that needs every penny it earns.
Understanding the dividend payout ratio helps you avoid the classic investor trap of chasing high dividend yields without checking if the company can actually afford them. When you know how to calculate and interpret this ratio, you can spot the difference between a reliable income stream and a dividend that's about to get cut. The math is simple, but the insights it provides about earnings per share and company health are worth their weight in gold.
Key Takeaways
The dividend payout ratio shows what percentage of net income a company distributes to shareholders as dividends
Calculating the ratio involves dividing dividends paid by net income or dividing dividends per share by earnings per share
Different industries have different normal payout ranges, so comparing ratios only makes sense within the same sector
Crunching the Numbers: How Companies Calculate Payout Ratios


You don't need a math degree to figure out the payout ratio, but you do need to understand two basic formulas. The calculation boils down to dividing dividends by earnings, whether you're looking at total company numbers or per-share figures.
The Mathematical Magic Behind the Formula
The dividend payout ratio formula comes in two flavors, and both give you the same answer. The first method uses company-wide totals: you take the total dividends and divide them by net income. If a company earned $50 million last year and paid out $10 million in dividends, you divide 10 by 50 to get 0.20, or 20%.
The second method breaks things down per share. You divide dividends per share (DPS) by earnings per share (EPS). If a company pays $2 per share in dividends and earns $8 per share, you divide 2 by 8 to get the same 20% payout ratio.
Both approaches work perfectly fine. You just pick whichever numbers you have handy.
You don't have to research them manually and instead, choose the brokerage that has these metrics on hand for you! Choose the best investing brokerage here.
Multiple Ways to Get to the Same Ratio
Your payout ratio calculation can take a shortcut through something called the retention ratio. This is the flip side of the payout ratio.
The retention ratio shows what percentage of earnings a company keeps instead of paying out. If you subtract the retention ratio from 1 (or 100%), you get the payout ratio. A company that retains 75% of its earnings pays out the remaining 25%.
You can calculate the retention ratio by taking EPS minus DPS, then dividing that number by EPS. It's just another path to the same destination.
Dividend per Share, EPS, and the Mysterious Retention Ratio
Getting accurate dividends per share and earnings per share numbers matters more than the actual math. You find DPS by dividing total dividends paid by the number of outstanding shares. For EPS, you subtract preferred dividends from net income, then divide by outstanding shares.
These two numbers tell different stories about your investment. Earnings per share shows what the company actually earned for each share you own. Dividends per share reveals how much of that money lands in your pocket.
The retention ratio completes the picture by showing what stays behind for growth, debt payoff, or rainy day savings.
But, like I said, choose the brokerage that has these metrics on hand for you!
Choose the best investing brokerage here.
More Than Just a Percentage: What Payout Ratios Really Tell You


The payout ratio isn't just a number to memorize for trivia night. It reveals whether your dividend income is built on solid ground or sitting on a house of cards ready to tumble at the first sign of trouble.
Dividend Sustainability and Danger Zones
A safe payout ratio means your dividend isn't going anywhere soon. Most healthy companies keep their ratios between 30% and 60%, which leaves plenty of room for earnings stability and growth.
When you see a payout ratio creeping above 80%, warning bells should start ringing. The company is handing out most of its profits as dividends, leaving little cushion for bad years. A payout ratio over 100% is basically a red flag waving at you from a sinking ship—the company is paying out more than it earns, which usually leads to dividend cuts down the road.
Watch out for dividend traps. These are stocks with sky-high dividend yields that look amazing until you check the payout ratio. A company paying 8% annually with a 95% payout ratio is one bad quarter away from slashing that dividend. Dividend safety requires breathing room in the numbers.
Companies can survive short-term spikes above 100% by using cash reserves. But this isn't sustainable long-term, and your annual dividend per share will likely get chopped when reality hits.
Industry Trends and Company Maturity
Your payout ratio expectations should change based on what type of company you're looking at. A tech startup with a 10% payout ratio isn't being stingy—it's reinvesting profits to grow. Meanwhile, a utility company with the same low payout ratio might be undervaluing shareholders.
Company maturity matters more than you think:
Young growth companies: 0-30% payout ratios are normal. They need cash for expansion.
Mature companies: 50-70% payout ratios show they've finished growing fast and want to reward shareholders.
Established income plays: 70-90% ratios are common in sectors like utilities and REITs, where dividend growth is the main attraction.
Real estate investment trusts legally must pay out 90% of earnings, so their high ratios aren't scary—they're required. Master limited partnerships follow similar rules. Compare companies within the same industry, not across different sectors, or you'll draw the wrong conclusions about dividend safety.
The Tussle Between Dividend Yield and Payout Ratio
Here's where things get interesting. Dividend yield tells you how much cash you're getting relative to the stock price. Payout ratio tells you if that cash flow can continue.
A 7% dividend yield sounds incredible until you realize the payout ratio is 120% and the company is burning through savings. That's the difference between dividend income you can count on and dividend income that's about to vanish.
Payout ratio vs dividend yield comparison:
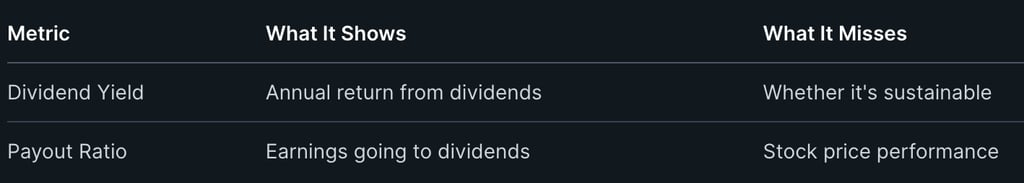
Smart investors check both numbers. A rising payout ratio paired with stable earnings shows a company committed to dividend growth. But if earnings are falling and the ratio is rising, that's just math telling you a dividend cut is coming. Your annual dividends per share look safe only when both the yield and payout ratio tell the same story.
Putting Ratios to Work: How Investors Use Payout Metrics
Smart investors check payout ratios before buying dividend-paying stocks to judge if the company can keep sending those checks. The ratio tells you whether management is being realistic or reckless, and it helps you spot which stocks fit your goals—whether you want steady income now or growth later.
Spotting Good, Bad, and Downright Ugly Ratios
Income investors typically hunt for payout ratios between 35% and 60%. This range shows the company pays you reliably while keeping enough cash to handle problems. Blue chip stocks often sit in this sweet spot.
Growth investors prefer lower ratios, often under 35%. These companies plow more money back into the business instead of handing it to you. That's not stingy—it's strategic.
Watch out for ratios above 80%. Your dividend might be living on borrowed time. Dividend aristocrats (companies that raised dividends for 25+ years straight) rarely go this high because they've learned not to overpromise.
A ratio over 100% means trouble. The company pays out more than it earns, which is like spending your rent money on lottery tickets. This screams dividend cut risk. Companies can't keep this up forever without burning through savings or piling up debt.
Passive Income, Blue Chips, and Dividend Aristocrats
Dividend investing for passive income means finding companies that won't ghost you when times get tough. Blue chip stocks in utilities, consumer staples, and healthcare typically maintain stable ratios because people always need electricity, toothpaste, and medicine.
Look at management priorities through the payout ratio. A steady 50% ratio for ten years shows discipline. Wild swings suggest the board can't decide between paying you and funding the business.
Dividend aristocrats prove their worth by raising payments even during recessions. They balance dividend policy with business needs, typically keeping ratios between 40% and 65%. Their track record beats companies that promise big payouts but fold when the economy hiccups.
When Regulators and Cash Flow Crash the Party
Earnings don't always match actual cash. That's why serious financial analysis includes checking the cash flow statement. The free cash flow payout ratio divides dividends by free cash flow (FCF) instead of net income. This tells you if the company actually has the cash to pay you.
Calculate FCF by taking operating cash flow minus capital expenditures. If the FCF payout ratio exceeds 100%, your dividend is built on sand.
REITs use the FFO payout ratio (funds from operations) because standard earnings don't capture their business model well. Dividend metrics vary by industry, so compare companies within the same sector.
Check debt-to-equity ratio and working capital too. A company drowning in debt might cut dividends to stay afloat, even with a decent payout ratio on paper.
When High Payout Ratios Make Sense (And When They Don't)
A high payout ratio isn't automatically bad, but context matters more than the number itself. Companies with steady, predictable cash flows can safely maintain high dividend payout ratio levels without putting their dividend distribution at risk.
Utilities and consumer staples often run payout ratios above 70% because their earnings are stable and predictable. These businesses don't need massive retained earnings for expansion since they're already mature. A grocery chain doesn't need to reinvent itself every quarter.
But here's where you need to watch out: a payout ratio over 100% means the company is paying more in dividends than it actually earned. That's not sustainable unless it's a temporary blip. Some companies will dip into cash reserves or borrow money to maintain dividends during a rough year, hoping to avoid the stock price hit that comes with a dividend cut.
Look at normalized earnings, not just one year's results. If a company earned $2 per share for five years straight but only $0.50 this year due to one-time restructuring costs, a 200% payout ratio might not spell doom. But if earnings have been declining for three straight years while the dividend stayed flat, you're looking at trouble.
Sector Superstars: REITs, Utilities, and the Like
Real estate investment trusts play by their own rulebook, and that changes everything about dividend analysis.
Here's the twist: standard payout ratios don't work well for REITs because depreciation and amortization reduce reported earnings even when cash flow remains strong. A REIT might show a 150% payout ratio based on net income but have plenty of actual cash to cover the dividend. You need to look at the total payout ratio using funds from operations instead.
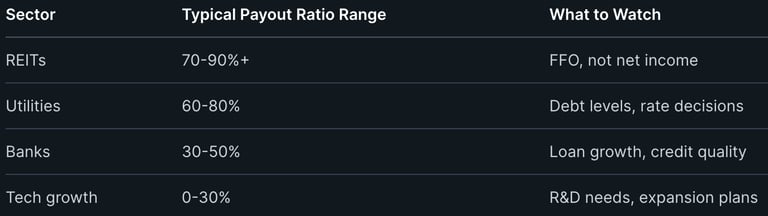
Banks also need special attention. A low dividend payout ratio at a bank might signal that management expects loan growth opportunities or needs to build capital reserves. Financial institutions have to maintain certain capital ratios, so they can't just pay out everything they earn.
Common Missteps and Final Words of Wisdom
Your biggest mistake would be chasing yield without checking the payout ratio first. A 12% dividend yield looks amazing until you realize the company is paying out 180% of earnings and heading toward a dividend cut that will crater the stock price.
Don't ignore the earnings trend. A company with a 50% payout ratio sounds safe, but if earnings have dropped 40% over two years while the dividend stayed flat, that ratio was 30% back when times were good. The trajectory matters as much as the current number.
Don't Let Buybacks Fool You
Some companies buy back their own shares to increase earnings per share (EPS). While buybacks can be a good use of cash, they can also make a company's financial health look stronger than it really is.
That's why it's important to look beyond the dividend alone.
Ask yourself:
Is the company generating enough cash to support both its dividends and share buybacks?
Or is it stretching its finances to keep investors happy?
Bottom Line
A healthy dividend isn't just about what a company pays—it's about what it can realistically afford.
Always look at the company's overall cash generation, not just higher earnings per share or an attractive dividend yield. Those numbers don't always tell the full story.
Return on equity also deserves your attention. A company with low ROE and a high payout ratio has less room for error. If they're barely profitable and paying out most of their earnings, one bad quarter could force tough choices.
Sustainable dividends come from companies with reasonable payout ratios relative to their sector, stable or growing earnings, manageable debt levels, and business models that generate consistent cash flow. Dividend growth stocks typically maintain lower payout ratios (30-60%) to fund both dividend increases and business reinvestment.
Now, go and check out those payout ratios for stocks you're interested in!
Contact
kbgholston445@gmail.com
© 2025. All rights reserved.