This Dividend Investor Did Everything Right — Except Read the One Financial Statement That Mattered
I screened the stock. I checked the yield. But, I never looked at the cash flow statement. Here's how to read all three financial statements before your next dividend stock purchase — and what to look for in each one.
6/24/202613 min read


These aren't just boring documents that accountants create to torture business students. Financial statements tell you whether a company is making money, drowning in debt, or burning through cash faster than a lottery winner. Publicly traded companies must share these reports, which means you have access to the same information that professional investors use to make decisions.
Learning to read financial statements might sound intimidating, but it's simpler than you think. Once you understand what each statement shows and how they connect, you'll be able to spot red flags, find hidden opportunities, and invest with confidence instead of crossing your fingers and hoping for the best.
Key Takeaways
The income statement shows whether a company is actually making a profit from its business operations
The balance sheet reveals what a company owns and owes at a specific point in time
The cash flow statement tracks where money is coming from and going to, showing the real movement of cash in the business
Decoding the Income Statement: Tracking Profits and Losses
When you buy a piece of a company, you're trusting that business with your hard-earned money. You wouldn't hand over cash to a stranger without asking questions, so why would you invest blindly? The three core financial statements—the income statement, balance sheet, and cash flow statement—are the tools that let you see exactly what's happening with your money inside a company. Think of them as a company's report card, bank statement, and spending diary all rolled into one.


The income statement reveals whether a company actually makes money or just burns through cash. Revenue shows what comes in the door, cost of goods sold and operating expenses show what goes out, and net income tells you what's left over for shareholders like you.
Key Line Items: Revenue, COGS, and Net Income
Revenue sits at the top of every income statement for a reason. It's the total money a company brings in from selling products or services before anyone takes a cut. You'll sometimes see this called the "top line" because accountants are very literal people.
Cost of goods sold (COGS) comes next and includes the direct costs of making whatever the company sells. For a pizza shop, that's flour, cheese, and pepperoni. For a software company, it might be server costs and cloud hosting. Subtract COGS from revenue and you get gross profit.
Operating expenses cover everything else needed to run the business. These include employee salaries, rent, utilities, marketing costs, and research and development. Some companies spend billions on R&D while others spend almost nothing.
Operating income (also called EBIT, or earnings before interest and taxes) shows profit from core business activities. Then you subtract interest expense and taxes to reach net income. This bottom-line number tells you if the company actually made money. Positive net income means profits that could become dividends. Negative net income means losses, and dividend cuts might be coming.
Profit Margins, EBITDA, and Performance Metrics
Gross profit margin tells you how much money remains after production costs. Calculate it by dividing gross profit by revenue. A company with $100 in revenue and $60 in COGS has a 40% gross margin. Higher margins usually mean stronger pricing power or lower costs.
Operating margin divides operating income by revenue. This shows how efficiently management runs the core business after paying for everything from factory workers to the CEO's golf outings.
Net profit margin is net income divided by revenue. A 10% net margin means the company keeps $0.10 of every dollar in sales. Compare these margins across competitors to spot the efficient operators from the money pits.
EBITDA (earnings before interest, taxes, depreciation, and amortization) strips out accounting moves and financing decisions to show raw operating performance. Some investors love it. Others think it's a way for unprofitable companies to look less terrible. Both groups have valid points.
Earnings per share (EPS) divides net income by the number of shares outstanding. Growing EPS often supports dividend growth because there's more profit per share to distribute.
Ok I know, sounding too complicated? Don:t worry I got you.
Start by clicking this article to focus on the only 3 metrics you should pay attention to!!
Analyzing Trends in Profitability Over Time
Single quarters lie to you constantly. A bad quarter might reflect temporary problems. A good quarter might hide deeper issues. Look at trends across multiple years instead.
Compare revenue growth rates year over year. Steady 5-10% growth beats wild swings between 30% gains and 20% drops. Predictable growth makes dividend payments safer.
Watch what happens to profit margins over time. Shrinking margins suggest rising costs or brutal competition. Expanding margins indicate pricing power or improving efficiency. For dividend investors, stable or growing margins provide the cash flow that funds your payments.
Check if the company maintains profitability during economic downturns. Companies that stayed profitable during 2008 or 2020 proved they can handle tough times. Your dividends depend on that resilience.
Common Misconceptions and Limitations
The income statement doesn't show cash flow. A company can report net income while running out of actual money. Revenue gets recorded when sales happen, not when customers pay. That's why profitable companies sometimes can't afford their dividend payments.
Depreciation and amortization are non-cash expenses that reduce net income without touching the bank account. A company might look less profitable than it really is because of these accounting entries. EBITDA tries to fix this, but it can also hide real economic costs.
One-time charges and restructuring costs clutter up income statements like junk in your garage. Companies sometimes exclude these items to show "adjusted" earnings that look better. Be skeptical when management talks about adjusted numbers more than actual net income.
The income statement covers a specific time period but doesn't show timing of cash movements. A company might book huge revenue in December but not collect payment until March. Your dividend check depends on cash in the bank, not numbers on the income statement.
Different accounting methods let companies make choices that affect reported profit and loss. Two identical businesses can show different profitability based on inventory methods or revenue recognition policies. Compare companies within the same industry where accounting practices are similar.
The Balance Sheet: A Snapshot of Financial Health


The balance sheet shows you what a company owns, what it owes, and what's left over for shareholders at a specific moment in time. This financial statement helps you measure whether a company can pay its bills, handle its debt, and maintain the dividend checks you're hoping to deposit.
Understanding Assets, Liabilities, and Shareholders' Equity
The balance sheet works on a simple formula: Assets = Liabilities + Shareholders' Equity. Think of it as the company's financial selfie, frozen in time.
Assets are everything the company owns that has value. This includes cash, inventory, buildings, equipment, and money customers owe the company. If it can be sold or used to generate revenue, it's an asset.
Liabilities represent what the company owes to others. These include accounts payable to suppliers, loans from banks, and bonds issued to investors. Basically, these are the company's IOUs.
Shareholders' equity is what's left over after you subtract liabilities from assets. This includes money investors originally put in plus retained earnings the company has accumulated over time. Retained earnings matter for dividend investors because companies pay dividends from this pot of accumulated profits.
Measuring Liquidity, Solvency, and Stability
Liquidity tells you if a company can pay its short-term bills without selling off the office furniture. The current ratio divides current assets by current liabilities. A ratio above 1.0 means the company has more short-term assets than short-term debts.
The quick ratio is pickier. It removes inventory from current assets because you can't always sell inventory quickly. A quick ratio above 1.0 suggests the company won't need to panic-sell products to make payroll.
Solvency measures whether a company can handle its long-term debt levels. Too much debt means more interest payments, which leaves less cash for dividends. You want companies with manageable debt relative to their assets and equity.
Working capital equals current assets minus current liabilities. Positive working capital means the company has breathing room. Negative working capital might mean trouble ahead, especially for maintaining those dividend payments you're counting on.
Overwhelmed again? Check out this artcile to simplify!
Current vs. Long-Term Items: Inventory, Receivables, and Debt
Current assets include cash and items that will convert to cash within one year. Accounts receivable shows money customers owe, while inventory sits on shelves waiting to be sold. High inventory levels might signal weak sales or poor planning.
Long-term assets include property, equipment, and investments the company plans to hold beyond one year. These assets generate revenue over time but can't be quickly converted to cash.
Current liabilities must be paid within one year. Accounts payable represents money owed to suppliers. High current liabilities compared to current assets can squeeze a company's ability to maintain dividend payments.
Long-term liabilities include bonds and loans due after one year. Your job as a dividend investor is to check whether debt levels seem reasonable. Companies drowning in debt often cut dividends first when trouble hits.
Connecting the Balance Sheet to Overall Financial Position
The balance sheet reveals a company's capital structure, which is the mix of debt and equity used to finance operations. Companies with too much debt face higher interest costs that eat into profits available for dividends.
A strong financial position means solid assets, manageable liabilities, and growing shareholders' equity. You want to see retained earnings increasing over time, which suggests the company generates more profit than it pays out.
Compare the balance sheet to previous periods. Growing assets and equity signal expansion. Shrinking equity or ballooning debt levels raise red flags about the company's stability and its ability to keep sending you those dividend checks.
The statement of financial position connects to other financial statements too. Profits from the income statement flow into retained earnings on the balance sheet. Cash from operations affects the cash line item you see listed under current assets.
Cash Flow Statement: Where the Money Actually Went
The cash flow statement shows you where a company's cash actually came from and where it went during a specific time period. This statement breaks down cash movements into three main categories: operating activities (day-to-day business), investing activities (buying or selling assets), and financing activities (dealing with investors and lenders).
Operating, Investing, and Financing Activities Explained
Operating activities show cash from the company's main business operations. This includes money collected from customers and cash paid to suppliers and employees. Operating cash flow tells you if the business can generate enough cash to keep running without needing outside money.
Investing activities track cash spent on or received from long-term assets. When a company buys equipment or buildings, that's a cash outflow. When it sells old machinery, that's a cash inflow. Capital expenditures (money spent on assets) show up here.
Financing activities deal with money moving between the company and its investors or lenders. This includes cash from issuing stock, money paid out as dividend payments, and loans taken or repaid. If you're tracking dividends as an investor, you'll find those cash outflows in this section.
Spotting Positive (and Not-So-Positive) Cash Flow
Positive cash flow from operations means the business generates more cash than it spends on daily operations. This is what you want to see as an investor. A company can show profits on the income statement but still run out of cash if customers don't pay on time.
Watch for companies with negative operating cash flow over multiple quarters. They're burning through cash and might need to borrow money or sell stock to survive. One bad quarter happens, but a pattern signals trouble.
Compare the cash balance at the beginning and end of the period. Growing cash reserves give companies flexibility to pay dividends, invest in growth, or weather tough times. Shrinking cash means they're spending more than they're bringing in.
Non-Cash Expenses and Why They Don't Buy You Coffee
ne reason financial statements can be confusing is that some expenses reduce reported profit without actually reducing cash.
These are called non-cash expenses.
The most common example is depreciation.
Let’s say a company buys a machine for $100,000. Instead of recording the full cost all at once, accounting rules spread that expense over several years. Each year, a portion of the machine’s cost shows up on the income statement as depreciation.
That lowers reported earnings—but it doesn’t mean cash left the business that year. The company already paid for the machine earlier.
That’s why the cash flow statement adds depreciation and other non-cash expenses back to net income. It helps show how much cash the business actually generated from operations.
Bottom Line
A company can look less profitable on paper because of depreciation, even if its cash generation is still strong.
That’s why dividend investors shouldn’t stop at earnings alone.
Before trusting a dividend, look at the cash flow statement too. It gives you a clearer picture of whether the business is producing real cash to support future dividend payments.
Using Cash Flow Data for Better Forecasting
Past cash flow patterns help predict future performance. Look at operating cash flow trends over three to five years. Consistent growth suggests a healthy business that can fund future dividends and capital investments.
Compare cash from operations to capital expenditures. Companies need to invest in assets to maintain and grow their business. If operating cash flow consistently exceeds capital spending, the company generates "free cash flow" that can fund dividend payments.
Strong cash flow gives companies options. They can increase dividends, buy back shares, or save for acquisitions. Weak cash flow forces tough choices like cutting dividends or taking on debt.
Reading Between the Lines: How the Three Statements Work Together
The real magic happens when you stop reading each financial statement in isolation and start seeing how they tell one complete story. Understanding these connections helps you spot accounting tricks, evaluate cash generation, and determine whether a company's profits are real or just paper gains.
The Interconnected Nature of Financial Reports
The income statement, balance sheet, and cash flow statement don’t work separately—they all connect.
A simple way to think about it is this:
The income statement shows profit
The balance sheet shows what the company owns and owes
The cash flow statement shows where the cash actually moved
Here’s how they link together.
1. Net income starts on the income statement
That profit figure flows into the cash flow statement and also affects retained earnings on the balance sheet.
2. Non-cash expenses get adjusted on the cash flow statement
For example, depreciation lowers profit on the income statement, but it doesn’t use up cash in that period. So it gets added back on the cash flow statement.
3. Timing differences show up through working capital
A company can report revenue before the cash actually arrives. If customers haven’t paid yet, that money shows up as accounts receivable on the balance sheet. The cash flow statement adjusts for that because the business hasn’t collected the cash yet.
4. Cash ties everything together
The ending cash balance on the cash flow statement becomes the cash balance on the balance sheet.
If a company buys equipment:
Cash goes down
Capital expenditures show up on the cash flow statement
The equipment appears on the balance sheet as an asset
Over time, depreciation from that equipment lowers profit on the income statement
Bottom Line
You don’t need to memorize every accounting rule to become a better dividend investor.
You just need to understand one key idea:
Profit, assets, and cash are connected—but they are not the same thing.
That’s why strong dividend analysis looks at all three financial statements, not just earnings or yield. A company can look profitable on the income statement while cash flow is weak or debt is rising in the background.
If you want to know whether a dividend is truly safe, you have to follow how the money moves.
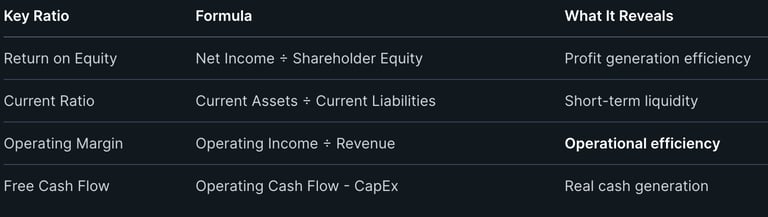
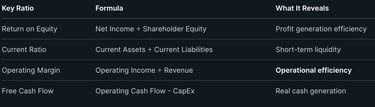
Key Ratios and Fundamental Analysis Tools
Financial ratios turn raw numbers into meaningful insights by showing relationships between different statement items. Return on equity (ROE) connects your income statement to your balance sheet by dividing net income by shareholder equity, telling you how efficiently management turns your investment into profits.
The current ratio (current assets divided by current liabilities) reveals whether you can pay short-term bills. The debt-to-equity ratio shows financial leverage. But here's the catch: you need multiple statements to calculate these properly.
What Financial Modeling and Forecasting Reveal
Financial modeling forces you to understand how statement connections actually work. When you build a model in Excel, you can't fudge the relationships—your balance sheet either balances or it doesn't.
Forecasting future performance requires assumptions about revenue growth, margins, and capital needs. But your assumptions must flow through all three statements consistently. If you forecast 20% revenue growth, you need to model the working capital changes, additional equipment purchases, and financing required to support that growth.
Professional analysts spend hours building integrated three-statement models for a reason. These models reveal whether growth plans are realistic or fantasy. You'll quickly discover if a company needs to raise money, can fund expansion internally, or is headed for a cash crunch.
Your model shows how changes ripple through the business. Extending payment terms to customers increases receivables, which reduces cash flow even while revenue grows. This kind of financial analysis is impossible when viewing statements separately.
Finding Real Insights Beyond the Numbers
Smart investors read annual reports and quarterly earnings reports looking for disconnects between the statements. Is net income growing while operating cash flow declines? That's a red flag that deserves investigation.
Check whether revenue growth requires proportional increases in receivables and inventory. Disproportionate growth in these areas suggests customers aren't paying or inventory is piling up. Both spell trouble that profits alone won't reveal.
Compare capital expenditures on the cash flow statement to depreciation on the income statement. If CapEx consistently runs below depreciation, the company is likely underinvesting in its business. Investor relations departments won't advertise this in press releases.
Look at how companies fund operations. Are they borrowing money to pay dividends? That shows up when financing activities provide cash while operations consume it. The income statement might look fine, but the full picture tells you management is playing games.
Conclusion
You've made it through the three financial statements without falling asleep. That's already better than most people at a dinner party!
The income statement shows you if a company is making money or just burning through cash like your cousin's failed food truck business. The balance sheet tells you what a company owns and owes at a specific moment in time. The cash flow statement reveals where money actually went, not just where the company says it went.
Here's what you need to remember:
These three statements work together like a financial puzzle
You can't understand a company's true health by looking at just one
Real cash movement matters more than accounting magic tricks
Think of it this way: the income statement is what the company says happened, the balance sheet is what they have right now, and the cash flow statement is what actually happened with their money.
Start practicing with real companies today. Pick a stock you're interested in and pull up their latest quarterly report. Look at all three statements. You'll probably feel confused at first, and that's fine. Every investor started exactly where you are now.
The difference between you and people who lose money in the market? You're willing to do the homework. You understand that investing without reading financial statements is like buying a house without looking inside first.
Now go find those financial reports and start reading.
Contact
kbgholston445@gmail.com
© 2025. All rights reserved.