Stop Checking Cash Flow. Start Checking WHICH Cash Flow — They're Not Telling You the Same Thing.
Operating cash flow and free cash flow can move in completely opposite directions — and the one most investors look at first is the less useful one for dividend safety. Here's the difference, when each number matters, and how to use both before you buy.
7/13/20268 min read


You might be wondering why you should care about the difference between types of "cash flow". After all, cash is cash, right? Not exactly. A company could have great operating cash flow but terrible free cash flow if it's spending a fortune on new factories or equipment. On the flip side, a business with decent free cash flow might be coasting on low capital spending, which could hurt it down the road.
Both metrics tell you different stories about a company's financial health. Understanding how they work together gives you a much clearer picture of whether a business is thriving or just barely keeping the lights on.
Key Takeaways
Operating cash flow measures cash from daily business operations before capital spending
Free cash flow is what remains after subtracting capital expenditures from operating cash flow
Both metrics appear on the cash flow statement and help you evaluate a company's financial strength
Understanding the Key Financial Metrics


Operating cash flow shows the money your business generates from daily operations, while free cash flow reveals what's left after you've paid for equipment and other big purchases. These two numbers tell different stories about your company's financial health and help you figure out if you're actually making money or just spinning your wheels.
Defining Operating Cash Flow (OCF)
Operating cash flow (OCF) represents the cash your business generates from its core operations. You'll find this number on your cash flow statement, which is one of the three main financial statements alongside your income statement and balance sheet.
To calculate OCF, you start with net income from your income statement. Then you add back non-cash expenses like depreciation and amortization because, while they reduce your earnings on paper, they don't actually take money out of your bank account. You also adjust for changes in working capital, which includes things like inventory, accounts receivable, and accounts payable.
Operating cash flow tells you if your business model actually works. You can have positive earnings (hello, EBITDA and EBIT) but still run out of cash if customers don't pay you on time or you're sitting on too much inventory.
Think of OCF as your financial pulse check. If this number is consistently negative, you're in trouble regardless of what your revenue looks like.
What Is Free Cash Flow (FCF)?
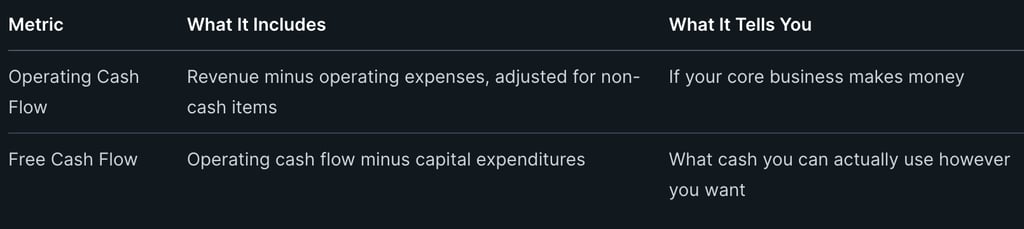
Free cash flow (FCF) is the money you have left after paying for everything your business needs to keep running and growing. It's basically your cash from operations minus capital expenditures (those big purchases like new equipment, buildings, or technology).
The formula is simple: FCF = Operating Cash Flow - Capital Expenditures. This number appears on your statement of cash flows, though you might need to do the math yourself since it's not always labeled clearly.
FCF matters because it shows what you can actually do with your money. Got positive free cash flow? You can pay dividends, buy back shares, pay down debt, or save it for a rainy day. Negative FCF means you're spending more than you're bringing in, which might be fine if you're investing heavily in growth but terrible if you're just burning through cash.
This metric is what keeps your creditors and investors awake at night. They want to see positive FCF because it means you can pay them back without needing to borrow more money.
Difference Between Free Cash Flow and Operating Cash Flow
The main difference is capital expenditures. Operating cash flow ignores how much you spend on property, equipment, and other long-term assets. Free cash flow accounts for these big purchases and shows what's truly available for discretionary spending.
OCF can look great while FCF looks terrible if you're buying a lot of equipment or opening new locations. A factory might generate strong cash from operations but have negative free cash flow because it's constantly upgrading machinery.
Here's how they compare:


Industries matter too. Tech companies often have high FCF because they don't need much equipment. Manufacturing companies typically have lower FCF because they're always buying or maintaining expensive machinery.
Cash Flow Metrics and Their Financial Importance
Cash flow metrics give you the real story behind your numbers. You can manipulate earnings with accounting tricks, but cash is cash. These metrics help you spot problems before they become disasters.
Operating cash flow reveals operational health. Positive OCF means your business model generates actual money, not just accounting profits. Analysts compare OCF to net income to see if your earnings are backed by real cash or just creative bookkeeping.
Free cash flow shows financial flexibility. Companies with strong FCF can weather economic downturns, invest in opportunities, and reward shareholders without taking on debt. Banks use FCF to decide how much they'll lend you because it proves you can make payments.
Both metrics appear on your cash flow statement, which is why savvy investors read all three financial statements instead of just the income statement. Revenue and EBITDA might look impressive, but if they don't convert to actual cash, you're heading for trouble.
You should track both numbers monthly or quarterly. Compare them to competitors in your industry and watch for trends over time.
How to Calculate OCF and FCF Like a Pro
You need to know the actual numbers behind these metrics to use them effectively. Operating cash flow starts with your net income and adds back non-cash expenses while adjusting for working capital changes, while free cash flow takes things further by subtracting capital expenditures from operating cash flow.
Operating Cash Flow Calculation Methods
There are two ways companies calculate Operating Cash Flow (OCF), but as an investor, you usually don't need to calculate it yourself.
The good news?
You'll find Operating Cash Flow already listed on the company's Cash Flow Statement.
Still, it's helpful to understand where the number comes from.
Method 1: Indirect Method (Most Common)
Most companies use the Indirect Method.
It starts with Net Income and adjusts for items that affected accounting profit but didn't involve actual cash.
A simplified formula looks like this:
Operating Cash Flow = Net Income + Non-Cash Expenses ± Changes in Working Capital
For example:
Add back depreciation because it reduced accounting profit but didn't use any cash.
Subtract increases in Accounts Receivable because the company made sales but hasn't collected the cash yet.
Add increases in Accounts Payable because the company hasn't paid those bills yet.
The result is a better picture of how much cash the business actually generated from its day-to-day operations.
But like I said, you'll find Operating Cash Flow already listed on the company's Cash Flow Statement.
Method 2: Direct Method
The Direct Method simply tracks the cash moving in and out of the business.
A simplified formula is:
Cash Received from Customers − Cash Paid for Operating Expenses = Operating Cash Flow
While this method is easier to understand, it's less commonly used because it requires companies to track every cash transaction separately.
Bottom Line
As an investor, you don't need to calculate Operating Cash Flow by hand.
Simply open the company's Cash Flow Statement and find the "Net Cash Provided by Operating Activities" (or similarly named line).
That's the number you want.
It saves time and gives you the same information without doing the math yourself.
Free Cash Flow Formulas and Adjustments
You calculate free cash flow by taking your operating cash flow and subtracting capital expenditures. The basic formula is:
Free Cash Flow = Operating Cash Flow - Capital Expenditures
Capital expenditures include money you spend on fixed assets like buildings, equipment, or machinery. These purchases maintain or expand your asset base. You subtract capital expenditures because this cash isn't available for other uses like paying dividends or reducing debt.
Some analysts make additional adjustments depending on what they're measuring. They might exclude one-time items or adjust for different types of capital spending. The standard formula works for most situations though.
Key Inputs: Net Income, Working Capital, and CapEx
Net income is your starting point for operating cash flow calculations. You find it at the bottom of your income statement. This number includes all revenues and expenses, even the non-cash ones.
Working capital changes show how much cash gets tied up or released from daily operations. When accounts receivable grows, cash gets stuck with customers who owe you money. When inventory increases, you've spent cash on products you haven't sold yet. When accounts payable rises, you're holding onto cash longer before paying suppliers.
Capital expenditures appear on your cash flow statement under investing activities. They represent cash spent on capital assets that will benefit your business for years. You need to track capex separately from operating expenses because it affects free cash flow but not operating cash flow.
Hands-On Examples: OCF vs FCF in Action
Let's say your company reports net income of $100,000. You had $20,000 in depreciation and amortization. Your accounts receivable increased by $10,000, and accounts payable went up by $5,000.
Your operating cash flow calculation looks like this:
Start with net income: $100,000
Add back depreciation and amortization: +$20,000
Subtract accounts receivable increase: -$10,000
Add accounts payable increase: +$5,000
Operating cash flow: $115,000
Now you spent $30,000 on new equipment during the period. To calculate free cash flow, you subtract that capital spending from operating cash flow. Your free cash flow equals $85,000 ($115,000 - $30,000).
This $85,000 represents cash available for debt payments, dividends, or business expansion.
Practical Applications and Strategic Insights
Both metrics serve distinct roles in evaluating how well your company manages money and whether it can sustain operations, grow, or reward investors. These numbers reveal different aspects of financial health and guide decisions about capital allocation, debt management, and future investments.
Financial Health and Performance Analysis
Operating cash flow tells you if your business generates enough money to cover daily expenses and stay afloat. It's your first checkpoint for financial health.
Free cash flow goes deeper. It shows what's left after you've paid for capital investments like new equipment or facilities. This number reveals your true financial flexibility.
Think of operating cash flow as your gross paycheck and free cash flow as what hits your bank account after rent and car payments. Both matter, but they tell different stories about your financial performance.
Positive free cash flow means you're generating surplus cash. Negative free cash flow suggests you're spending more on growth than you're bringing in from operations. Neither is automatically good or bad, but the trend matters for assessing sustainability.
Conclusion
You've now got the full scoop on operating cash flow and free cash flow. Think of operating cash flow as your company's paycheck from its day job. It shows whether the business can keep the lights on and pay the bills.
Free cash flow is what's left after you've splurged on new equipment and upgrades. It's the money you can actually play with, whether that means paying dividends, reducing debt, or expanding the business.
Both metrics matter for different reasons:
Operating cash flow tells you if the business model actually works
Free cash flow reveals whether there's money for growth and rewards
You can't judge a company's health by looking at just one of these numbers. A company might have great operating cash flow but terrible free cash flow if it's constantly buying expensive equipment. Or it might show mediocre operating cash flow but amazing free cash flow because it doesn't need much capital investment.
The smart move? Check both numbers before you invest. Compare them to competitors in the same industry. Look at trends over multiple quarters.
Your wallet will thank you for doing the homework.
Start reviewing cash flow statements today and you'll spot opportunities others miss.
You'll also dodge companies that look profitable on paper but are secretly bleeding cash behind the scenes.
Contact
kbgholston445@gmail.com
© 2025. All rights reserved.