Your ETF Is Charging You Every Single Day. You'll Never See the Bill.
The expense ratio isn't billed annually — it's deducted from your returns daily, invisibly, without a line item on your statement. Here's what that quiet compounding actually costs over 20 or 30 years — and the number that makes most investors do a double take.
7/16/20267 min read
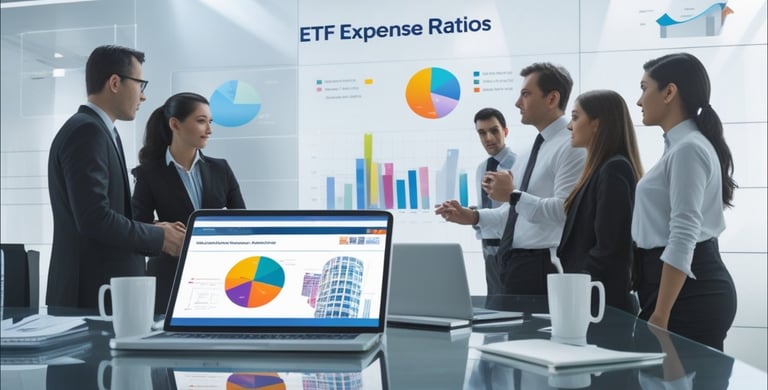
An expense ratio is the percentage of your investment that you pay each year to own an ETF, with most equity ETFs charging around 0.16% and bond ETFs averaging 0.12%. For every $10,000 you invest in an ETF with a 0.20% expense ratio, you'll pay $20 per year. These costs cover portfolio management, administration, marketing, and other operational expenses that keep the fund running.
The expense ratio you pay depends on several factors, including whether your ETF tracks an index passively or uses active management. Exchange-traded funds generally have lower expense ratios than traditional mutual funds because they cost less to operate. Learning how to evaluate these fees will help you choose investment options that keep more money working for you instead of going toward fund expenses.
Key Takeaways
ETF expense ratios are annual fees expressed as a percentage that reduce your investment returns
Lower expense ratios typically mean better long-term performance when comparing similar funds
Passive index funds usually charge less than actively managed funds due to lower operating costs
Understanding ETF Expense Ratios


Expense ratios represent the yearly cost of owning an ETF, expressed as a percentage of your investment. These fees cover everything from portfolio management to administrative work, and they're automatically deducted from the fund's returns before you see them.
What Is an Expense Ratio?
An expense ratio tells you how much you'll pay annually to own an ETF. It's calculated as a percentage of your total investment.
If an ETF has an expense ratio of 0.20%, you pay $20 per year for every $10,000 you invest. You won't receive a bill for this amount. Instead, the fee gets deducted directly from the fund's assets throughout the year.
The total expense ratio captures all the costs of running the fund. Your returns are what's left after these expenses are taken out. For example, if an ETF earns 9% before expenses and has a 0.10% expense ratio, your actual return is 8.90%.
This makes expense ratios work like a drag on your investment performance. Lower expense ratios mean more money stays in your account.
How ETF Expense Ratios Are Calculated
ETF companies calculate expense ratios by: total operating expenses ➗ the fund's average net assets. The formula is straightforward.
If an ETF manages $100 million in assets and spends $200,000 to operate the fund that year, the expense ratio equals 0.20%. Fund companies perform this calculation annually and adjust the ratio as needed.
The gross expense ratio shows total costs before any fee waivers. The net expense ratio reflects what you actually pay after the fund company applies any temporary fee reductions or waivers.
Components of Operating Expenses
Operating expenses include several types of costs that keep an ETF running:
Management fees pay for the portfolio managers and analysts who make investment decisions or maintain index tracking. These typically form the largest portion of the expense ratio.
Administrative expenses cover day-to-day operations like recordkeeping, legal services, accounting, and custody of the fund's assets. These costs keep the fund compliant and functioning properly.
12b-1 fees pay for marketing and distribution expenses, though most ETFs don't charge these fees. When present, 12b-1 fees can add to your total costs.
Administrative costs also include reporting requirements, shareholder communications, and regulatory filings. All these expenses get bundled together and divided across all fund shareholders based on their investment amount.
Types of ETF Fees and Their Impact

ETF ownership costs extend beyond the basic expense ratio. Trading costs, platform-specific charges, and promotional adjustments all affect your actual investment returns in ways that aren't immediately visible.
Trading Costs and Bid/Ask Spread
The bid/ask spread represents the difference between what sellers want (ask) and what buyers offer (bid). When you purchase an ETF, you pay the ask price. When you sell, you receive the bid price. This spread becomes a real cost every time you trade.
Low-volume ETFs typically have wider spreads. A spread of $0.10 might seem small, but on a $10,000 purchase, you lose $100 immediately. High-volume ETFs often show spreads of just a penny or two.
Your trading frequency matters. Frequent traders pay these costs repeatedly, while buy-and-hold investors only encounter spreads when entering and exiting positions.
Trading commissions have largely disappeared with commission-free ETFs now standard at major brokers. However, some trading platforms still charge per-transaction fees ranging from $5 to $20. These fees add up quickly if you make regular purchases or rebalance your portfolio monthly.
Additional Fund Fees and Hidden Charges
Beyond the expense ratio, several fund fees can impact your returns. Redemption fees apply when you sell shares within a specific timeframe, typically 30 to 90 days. These fees discourage short-term trading and usually range from 0.5% to 2%.
Your trading platform may charge custody fees to hold your investments. These appear as annual account maintenance fees, often $25 to $75 per year for smaller accounts. Many brokers waive these fees if you maintain minimum balances or enroll in electronic statements.
Transaction fees occur when your broker processes trades, separate from trading commissions. Some platforms charge $0.01 to $0.03 per share for certain ETF transactions, which adds up on large orders.
Comparing ETF Expense Ratios Across Fund Types
Different types of ETFs charge different fees based on how they're managed and what they invest in. Passive index funds typically cost 0.02% to 0.10%, while actively managed funds range from 0.40% to 0.75% or more.
Passive vs. Active Management
Passive ETFs track a market index without trying to beat it. Active management involves fund managers making buying and selling decisions to outperform the market.
The cost difference is significant. Passive ETFs average around 0.08% in expense ratios because they simply follow an index with minimal trading. Actively managed ETFs charge 0.40% to 0.75% or higher because you're paying for research teams, analysts, and frequent trading.
Actively managed funds must outperform their passive counterparts by at least their fee difference just to break even. If an active fund charges 0.70% and a passive fund costs 0.03%, the active fund needs to beat the market by 0.67% annually just to match the passive fund's returns. Most actively managed funds fail to do this consistently over long periods.
Popular ETFs and Their Expense Ratios
The most widely held ETFs show how low costs have become for basic market exposure:
US Stock Market ETFs:
SPLG: 0.02%
VOO: 0.03%
VTI: 0.03%
FXAIX (mutual fund): 0.015%
International and Bond ETFs:
VEA: 0.05%
VXUS: 0.07%
BND: 0.03%
These popular options have driven the industry average down because they hold trillions in combined assets. When you invest in a total market fund like VTI, you get exposure to thousands of companies for just $30 per year on a $100,000 investment. The difference between a 0.02% and 0.03% expense ratio is minimal, but the gap between low-cost index ETFs and expensive actively managed funds can cost you tens of thousands over decades.
Evaluating the True Cost of ETF Investing
Investment costs extend beyond the annual percentage you see listed. Fees compound over time and can significantly reduce your portfolio value, making it essential to understand both immediate and long-term impacts when selecting ETFs.
How Fees Compound Over Time
When you pay an expense ratio each year, you're not just losing that percentage of your current investment. You're also losing all the future growth that money would have generated.
Consider a
$10,000 investment growing at 8% annually over 30 years.
With a 0.10% expense ratio, your investment grows to $97,868.
With a 0.75% expense ratio, it grows to only $74,087.
That 0.65% difference in fees costs you $23,781.
The cost of high expense ratios becomes more severe with larger portfolios and longer time periods. Every dollar paid in fees today eliminates the compound growth that dollar would have produced over decades. This is why even small differences in expense ratios matter significantly.
Choosing ETFs With Favorable Cost Structures
Start by comparing expense ratios within the same fund category. Equity ETFs averaged 0.16% in 2021, while bond ETFs averaged 0.12%. Your ETF should fall at or below these benchmarks.
Larger ETFs often have lower costs due to economies of scale. Funds with higher average net assets can spread their operating expenses across more investors, reducing the percentage each person pays.
Key factors to evaluate:
Fund size - Larger net assets typically mean lower expense ratios
Management style - Passive funds cost less than active funds
Asset type - Bond ETFs generally cost less than equity ETFs
Avoid paying premium fees unless you have clear evidence the fund's performance justifies the higher cost.
Using Tools and Resources to Compare ETFs
An ETF screener lets you filter funds by category and sort by expense ratio. You can compare similar ETFs side by side to find the lowest-cost options.
Most major investment platforms offer free screeners. Enter your preferred asset class, then sort results from lowest to highest expense ratio. Check the fund's total net assets to ensure adequate liquidity.
Beyond the screener, review each fund's prospectus for a complete fee breakdown. Look at historical performance after fees to see actual investor returns. Compare at least three similar ETFs before making your decision.
Conclusion
ETF expense ratios directly affect how much money you keep from your investments. These annual fees are taken from your fund's assets, not billed separately. A 0.20% expense ratio means you pay $20 per year for every $10,000 you invest.
Lower expense ratios give you better returns over time. The difference between a 0.10% and 0.50% expense ratio might seem small, but it adds up to thousands of dollars over decades of investing.
You should compare expense ratios when choosing between similar ETFs. Use these guidelines:
Equity ETFs: Look for ratios around 0.16% or lower
Bond ETFs: Aim for 0.12% or lower
Passively managed funds: Should cost less than actively managed funds
Your research should include more than just the expense ratio. Check the fund's historical returns and total assets under management. Sometimes a slightly higher fee makes sense if the fund has consistently strong performance.
Start reviewing your current ETF holdings today. Find each fund's expense ratio in its prospectus under the "Fees and Expenses" section.
Compare your costs to similar ETFs using a fund screener tool.
Every dollar you save on fees is a dollar that stays invested and compounds over time. Small differences in expense ratios lead to big differences in your final account balance. Take control of your investment costs now to maximize your long-term wealth.
Contact
kbgholston445@gmail.com
© 2025. All rights reserved.